ChEMBL Using Highcharts
 We have released and update to the ChEMBLdb Interface, the most significant of all the changes is the inclusion of the Highcharts javascript charting library. If you are not familiar with this library have a look at the demo page to get an idea of its capabilities. In the ChEMBLdb interface we used the library to update the Target Browser page and introduced a scatter plot view for compound result sets.
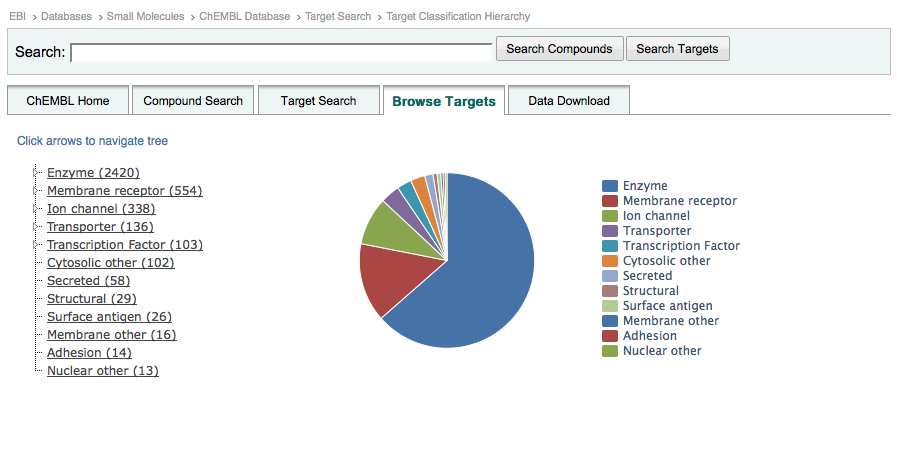
Target Browser Update
The new target browser can seen below:

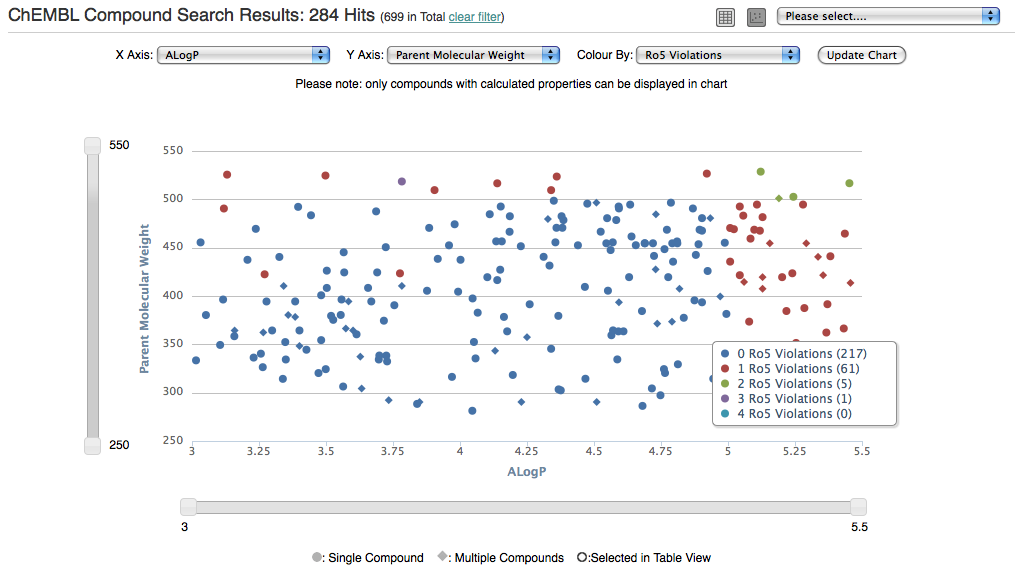
Scatter Plot View
For compound searches returning less than 1000 compounds users can switch from a tabular view to a chart view:
 Chart features include:
- Properties plotted on each axis can be updated, defaults to MW vs ALogP
- Compound colouring can updated, defaults number of Rule of Five violations
- Axis sliders can be used to 'zoom-in' to specific areas on the chart
- Clicking on a point in the scatter plot displays an image of the compound
We hope you like this addition to the interface and expect to see more Highcharts data visualisations soon.