On March 19th the FDA approved Florbetaben F18 (Neuraceq™) as a radioactive diagnostic agent for Positron Emission Tomography (PET) imaging of the brain to estimate β-amyloid (βA) neuritic plaque density in adult patients with cognitive impairment who are being evaluated for Alzheimer’s disease or other causes of cognitive decline.
Alzheimer's disease is the most common form of dementia, can currently not be cured and is characterised by a progressive disease pattern that usually leads to death. Alzheimer's is predicted to affect 1 in 85 people globally by 2050.
Target(s)
Florbetaben binds with high affinity to βA in brain homogenates and selectively labels βA plaques and cerebral amyloid angiopathy. βA (PDB ; Uniprot P05067) denotes 36-43 length peptides that are believed to be crucially involved in the Alzheimer's disease mechanism. βA aggregates in the brain of Alzheimer's patients and is derived from amyloid precursor protein which is cut by certain enzymes. βA and the resulting plaques are toxic to neurons. Following intravenous administration, Florbetaben F18 crosses the blood brain barrier and shows differential retention in brain regions that contain βA deposits. Differences in signal intensity between brain regions showing specific and non specific Florbetaben F18 uptake form the basis for the image interpretation method.
Florbetaben F18 (CHEMBL1908906; Pubchem : 53257383) is a small molecule drug with a molecular weight of 359.4 Da, an AlogP of 3.75, 12 rotatable bonds, and no rule of 5 violations. Florbetaben F18
The recommended dose of Neuraceq is 300 MBq (8.1 mCi), maximum 30 mcg mass dose, administered as a single
slow intravenous bolus (6 sec/mL) in a total volume of up to 10 mL. PET images should subsequently be acquired approximately 45 - 130 minutes after injection over a period of 15-20 minutes.
Warning / limitations of use
A positive Neuraceq scan does not establish the diagnosis of AD or any other cognitive disorder.
Safety and effectiveness of Neuraceq have not been established for:
Predicting development of dementia or other neurologic conditions;
Monitoring responses to therapies.
Neuraceq, similar to other radiopharmaceuticals, contributes to a patient's overall long-term cumulative radiation exposure. Long-term cumulative radiation exposure is associated with an increased risk of cancer.
Pharmacokinetics
Ten minutes after intravenous bolus injection of 300 MBq of Neuraceq in human volunteers, approximately 6% of the injected radioactivity was distributed to the brain. Florbetaben F 18 plasma concentrations declined by approximately 75% at 20 minutes post-injection, and by approximately 90% at 50 minutes.
Elimination
Florbetaben F18 is mainly eliminated via the hepatobiliary route with a mean half-life of approximately 1 hour.
Metabolism
Forbetaben F18 is metabolized mainly by CYP2J2 and CYP4F2.
License holder
The license holder is Piramal Imaging, the highlights of the prescribing information can be found here.
We have recently heard that our funding application for continuation of the ChEMBL database has been successful, and going forward the resource will be funded by The Wellcome Trust and core-funding from EMBL. Below is the text from the lay description of the application. First though, we must thank you, ChEMBL users, for your support and feedback to all that we do. There is a lot of exciting future data and technology to come, and we'll post more details about what we plan to do in future blog posts. As always, we are always happy to receive visitors for tea and cake!
Drug Discovery is costly, slow and complex, and despite much fundamental scientific progress, the translation of this into new safer medicines has been slower than anticipated. One of the key steps in drug discovery is the identification of specific drug-like bioactive compounds that modulate a gene believed to be causal in the treatment of a disease. Most new drugs are themselves chemically similar to old drugs, but target new proteins, or with improved properties and distribution within the body. Understanding the activity of previous drug-like compounds is therefore key to the discovery of new drugs. However, much of the data in drug discovery is locked away in patents, publications and within companies. Our work, the ChEMBL database, builds a large database of relationships between drugs, other bioactive compounds, genes and biological function to provide a unique resource linking Genomics, Biology and Chemistry. The data we provide is all completely Open and has become an important source of data for academic, rare and neglected disease, small companies and large Pharma therapeutic discovery.
In this current application we will develop:
1) Greater coverage of bioactivity space - to deepen and formalise the data contained in ChEMBL via further curation.
2) Enhanced indexing with ontologies - to provide more structured data and ease integration with other resources.
3) Patent coverage - extend chemical-structure/target data to include the patent literature.
4) Address variation data – to include annotation of resistance and natural population variation data.
5) Technology enhancements - including RDF forms of ChEMBL and development of an API to ease data entry and curation tasks.
6) Expanded user community of ChEMBL - develop interfaces with new beneficiaries in clinical and biotechnology communities.
On February 24th 2014, the FDA approved metreleptin (Tradename: Myalept), a leptin analogue, as an adjunct to diet and replacement therapy, for the treatment of complications associated with leptin deficiency in patients with congenital or acquired generalized lipodystrophy.
Lipodystrophy is a rare condition characterized by abnormalities in adipose (fat) tissue distribution. It can be congenital, i.e. the patient is born with little or no adipose tissue, or it can be acquired, for example, after prolonged antiretroviral drug therapy some patients keep on losing adipose tissue with time. The deficiency of adipose tissue leads to hypertriglyceridemia and ectopic deposition of fat in non-adipose tissues such as liver and muscle, contributing to metabolic abnormalities including insulin resistance.
Leptin is an endogenous hormone, predominantly secreted in the adipose tissue, responsible to signal to the central nervous system, the status of energy stores in the body. In patients with lipodystrophy, the levels of this hormone are lower, resulting in excess caloric intake, which exacerbates the metabolic abnormalities.
Metreleptin is a recombinant human leptin analogue, which exert its function by binding to and activating the human leptin receptor. This increases insulin sensitivity and reduces food intake, soothing the metabolic abnormalities of patients with lipodystrophy.
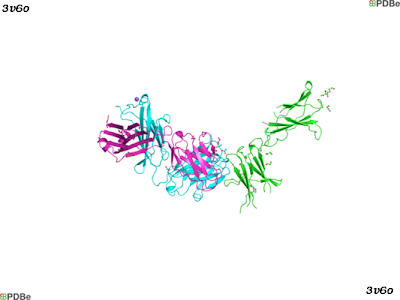
Leptin receptor (Uniprot accession: P48357; ChEMBL ID: CHEMBL5913) is a member of the cytokine family class I, which signals through the JAK/STAT transduction pathway. Currently, there is one crystal structure of the human leptin receptor in complex with an antibody (PDBe: 3v6o). The structure is shown bellow, and the leptin receptor is depicted in green.
The -leptin USAN/INN stem covers leptin derivatives. Metreleptin is the first approved drug of its class, and the only member so far. In Japan, metreleptin was approved on May 25 th 2013 for the treatment of metabolic disorders, including lipodystrophy (see PMID: 23740412).
Metreleptin (ChEMBL: CHEMBL2107857) is a recombinant human leptin analog produced in E. coli and differs from native human leptin by the addition of a methionine residue at its amino terminus. Metreleptin is a 147-amino acid, nonglycosylated, polypeptide with one disulfide bond between Cys-97 and Cys-147 and a molecular weight of approximately 16.15 kDa.
Metreleptin is available as a lyophilized cake, which is later reconstituted with bacteriostatic or preservative-free sterile water, for subcutaneous injection. The recommended starting daily dose is 0.06 mg/kg in patients weighting less than 40 kg, 2.5 mg in male patients weighting more than 40Kg, and 5 mg in female patients weighting more than 40 kg, with a respective maximum daily dose of 0.13 mg/kg, 10 mg and 10 mg. In healthy subjects, the peak serum concentration (Cmax) of leptin is reached at 4.0 to 4.3 hours after subcutaneous administration of single doses ranging from 0.1 to 0.3 mg/kg, and following intravenous administration of metreleptin, leptin volume of distribution is 370 ± 184 mL/kg for a dose of 0.3 mg/kg/day. Metreleptin bioavailability is not influence by food intake, hence it can be administered without regard to the timing of meals.
No formal metabolism studies have been conducted with metreleptin, however, nonclinical data indicates renal clearance is the major route of metreleptin elimination, with no apparent contribution of systemic metabolism or degradation. In healthy subjects, following single subcutaneous doses of 0.01 to 0.3 mg/mL, the half-life t1/2 of metreleptin is 3.8 to 4.7 hours.
Metreleptin has been approved with a black box warning due to the risks associated with the development of antimetreleptin antibodies that neutralize endogenous leptin and/or metreleptin and the risk for T-cell lymphoma. Consequently, metreleptin is only available through the Myalept Risk Evaluation and Mitigation Strategy (REMS) Program.
The license holder for MyaleptTM is Amylin Pharmaceuticals, a subsidiary of Bristol-Myers Squibb, and the full prescribing information can be found here.
The Open PHACTS Discovery Platform is a freely accessible infrastructure that semantically integrates publicly available data for applied life science R&D. The Platform provides a powerful Application Programming Interface (API) which allows application builders and researchers to query the integrated data using existing applications, to build new applications and to access the API using workflows tools (e.g. KNIME and Pipeline Pilot). Examples of such applications, which illustrate what can be achieved, include the Open PHACTS Explorer, ChemBioNavigator, and PharmaTrek.
The Open PHACTS Community Workshop in London on Thursday 26th June aims to introduce members of the academic community to the Open PHACTS Discovery Platform.
The workshop will be of interest to:
· Researchers who would benefit from directly querying the Open PHACTS API using scripting languages or by developing applications to consume the data.
· Lecturers & Principal Investigators who can use the Open PHACTS application ecosystem to access the data within the Open PHACTS Discovery Platform.
The Community Workshop will introduce attendees to the Open PHACTS API and showcase how it can be used to create new or enhance existing applications. We will demonstrate, using real life use-cases, how universities can use the Open PHACTS API and associated tools for teaching and research in drug discovery.
Venue: Burlington House, Piccadilly, London W1J 0BA
The Workshop is free to attend for those at academic institutions, for more information or to register please email london@openphactsfoundation.org.
EuroQSAR-2014 will be held in St.-Petersburg, Russia on August 31st - September 4th, 2014. The deadline for oral talks' abstracts submission to the EuroQSAR-2014 is April 23rd, 2014. The meeting, entitled Understanding Chemical-Biological Interactions, will include 9 plenary lectures and 28 oral communications, which will be selected from the submitted abstracts and will focus on:
Chemical-Biological Space: Representation, Visualisation and Navigation.
Chemo- and Bioinformatics Approaches to Multi-Target (Q)SAR.
Modeling of Protein-Ligand Interactions: Structure, Function and Dynamics.
Assessing Ligand Binding Kinetics.
Computational Toxicology in Drug and Chemical Safety Assessment.
Translational Bioinformatics: From Genomes to Drugs.
Emerging QSAR and Modeling Methods.
Two seminars/roundtables are also planned on the last day of the Symposium:
(Q)SAR-Related European Initiatives.
Employing Proper Statistical Approaches for QSAR Modeling and Best Publishing Practices.
Confirmed speakers include:
Opening Lecture - SAR, the Lifelong Learning for my Career Prof. Toshio FUJITA (KYOTO UNIVERSITY, Kyoto, Japan)
From QSAR to MQSPR and Beyond: Predictive Materials Informatics Using a Blend of Heuristic and Physics-Based Methods
Prof. Curt BRENEMAN (RENSSELAER EXPLORATORY CENTER FOR CHEMINFORMATICS RESEARCH, Troy, United States)
Integrating Pharmacometrics into Drug Development Dr Roberta BURSI (GRÜNENTHAL, Aachen, Germany)
Lead Discovery and Optimisation by Use of Interaction Kinetic Analysis Prof. Helena DANIELSON (UPPSALA UNIVERSITY, Uppsala, Sweden)
Navigation in Chemical Space Towards Biological Activity Dr Peter ERTL (NOVARTIS INSTITUTE FOR BIOMEDICAL RESEARCH, Basel,
Switzerland)
Computational Toxicology – An Essential Part of Drug Safety Dr Catrin HASSELGREN (ASTRAZENECA, Mölndal, Sweden)
Ensemble-Based Drug Design, Combining Protein Structures and Simulations Dr Will PITT (UCB PHARMA, Slough, United Kingdom)
The Metabolic Code
Prof. Brian SHOICHET (UNIVERSITY OF TORONTO, Toronto, Canada)
Closing Lecture - Opportunities and Challenges in Therapeutics Discovery and Development Dr John C. REED (F. HOFFMAN-LA-ROCHE, Basel, Switzerland)
Hansch Session
On the Nature of Non-Classical Hydrogen Bonds and Aromatic Interactions Prof. Anna LINUSSON (UMEA UNIVERSITY, Umea, Sweden)
Lessons Learned from the Invention of QSAR Can Inspire Other Breakthrough Discoveries Dr Yvonne C. MARTIN (MARTIN CONSULTING, Waukegan, United States)
The Road Ahead: New Challenges for Computational Forecasts Prof. Tudor I. OPREA (UNIVERSITY OF NEW MEXICO, Albuquerque, United States)
Molecular Design of Bivalent and Dual Action Drugs Prof. Nikolay S. ZEFIROV (MOSCOW STATE UNIVERSITY, Moscow, Russia)
Proceedings of the Symposium will be published in a special issue of the journal Molecular Informatics. More information you may find at the Symposium’s web-site: www.euroqsar2014.org
As promised in the previous post, the ChEMBL target prediction models are now available to download from here. Furthermore, here is an IPython Notebook that showcases how the models can be used in Python. As usual, your feedback is very welcome.
We have just had a paper accepted in PLoS Computational Biology on the work we've done on allosteric modulators (first mentioned on the blog here). The work is based on the mining of allosteric bioactivity points from ChEMBL_14. The data set of allosteric and non-allosteric interactions is available on our FTP site (here). This blogpost will just highlight some sections of the paper, but we would like to refer the interested reader to the full paper (here).
Dataset
The dataset contains ChEMBL annotated and cleaned data divided in both an 'allosteric' set and a 'non-allosteric' (or background) set. Abstracts and titles mentioning allosteric keywords were pulled and from the resulting papers we extracted the primary target and all bioactivities on this primary target. From the remainder of the papers we also retrieved the primary target and all bioactivities on this primary target in a similar manner.
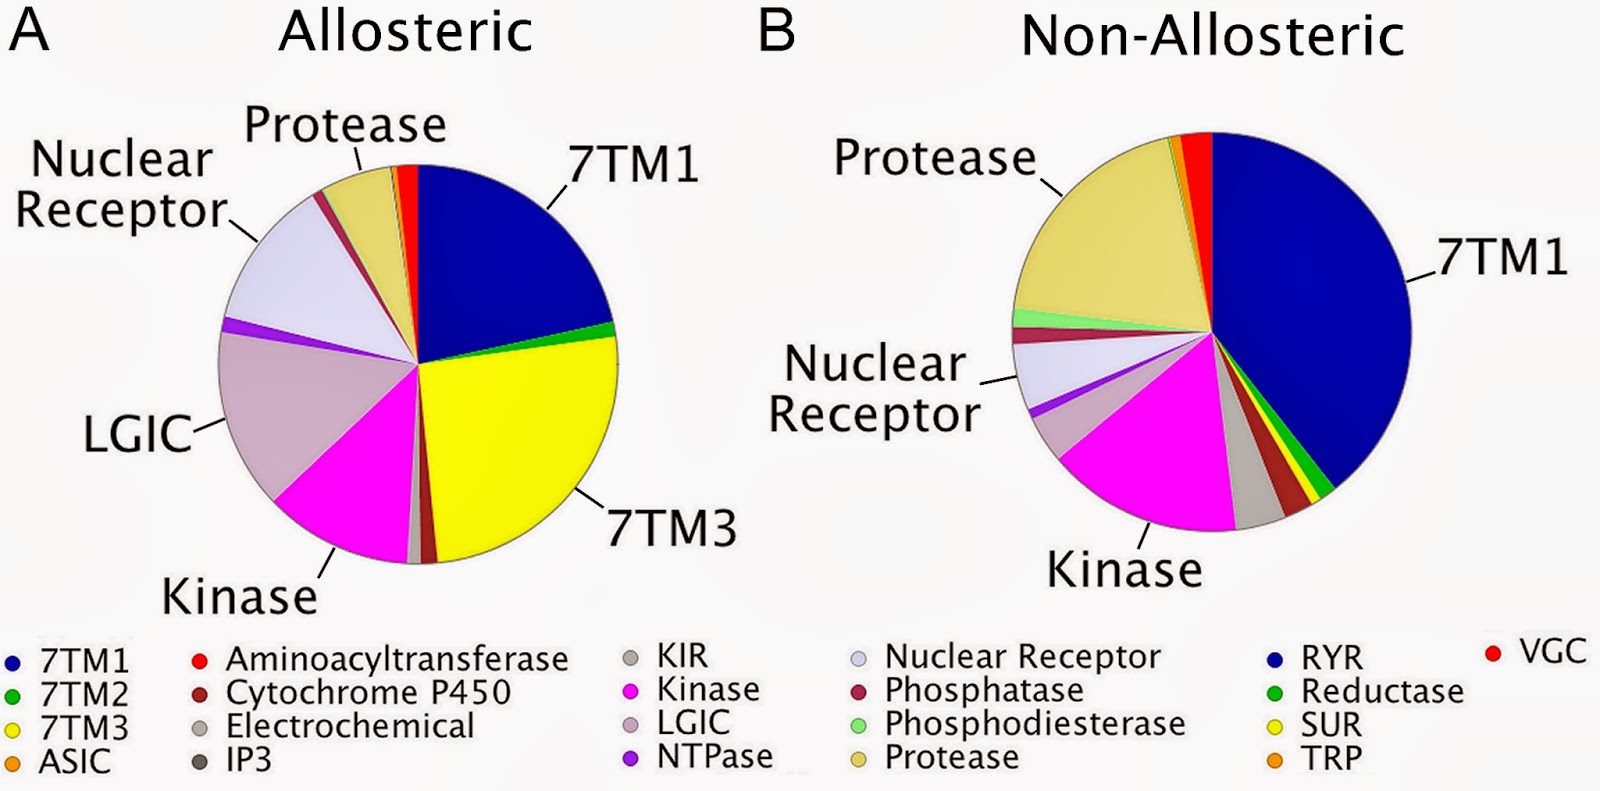
Targets
When we observed the target distribution in both sets, we saw differences (see below ; also touched upon in the previous post). Targets that are known to be amenable to allosteric modulation are indeed well represented in our allosteric set (e.g. Class C GPCRs). However there are also some interesting observations that we did not expect (please see the paper for further details).
Chemistry
Obviously, as we are the ChEMBL group, we are interested in potential chemical differences between the allosteric and background set. Interestingly, the allosteric modulators appear to form a subset of the background set, rather than that they are distinct from the background set. We have calculated a large number of descriptors and compared the sets (median values, but also histograms; all available on the FTP). We observe that allosteric modulator molecules tend to be smaller, more lipophilic and more rigid. Although there is understandably a large variance over the diverse targets included in the set. Shown here is the rigidity index calculated over the full sets (L0), but when the target selection becomes more concise, the differences become more distinct.
Bioactivity
Likewise we observe differences between our allosteric subset and the background set with regard to bioactivity. While 'allosteric modulation' is a very diverse concept, in which the specific manner wherein the protein is influenced by the small molecule differs per protein - ligand pair, we do observe some general differences. From our data it appears that allosteric modulators bind with a lower affinity (on average) but similar ligand efficiency (on average) when compared to our background set. In the paper we provide a more extensive discussion on this observation and we would again refer the reader given the limited space here.
Classification models
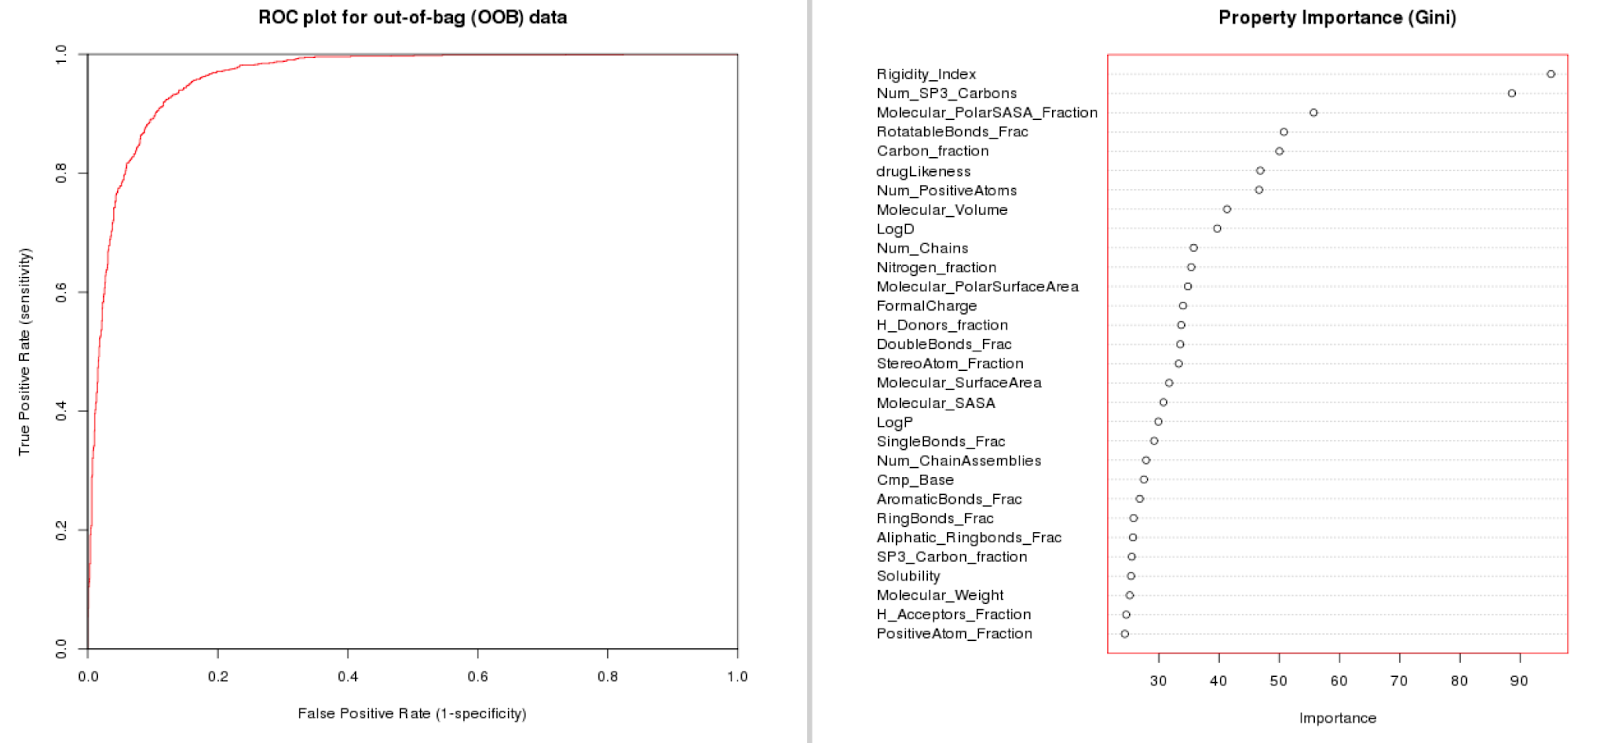
Built on the dataset we have created allosteric classifier models that can predict if an interaction is likely allosteric or not. We have tried this on the full dataset, but also on lower levels (restricting the data to e.g. Class A GPCRs). We find that we can train predictive models that gain in quality if we have a more concise dataset (eliminating some of the inter-target variation). In the paper we provide case studies on HIV Reverse Transcriptase, the adenosine receptors (family), and protein Kinase B. Here the model performance for class A GPCRs (full L2 tgt class) is shown. Note that rigidity, number of sp3 carbons, Polar Solvent Accessible Surface (normalized), and rotatable bonds fraction are most important for model fit.
All data is ChEMBL and hence can be freely downloaded and used. Please let us know if you find any errors or misclassifications as we will correct them (crowd curation).
Anna, jpo, and Gerard
%T Chemical, Target, and Bioactive Properties of Allosteric Modulation
%A G.J.P. van Westen
%A A. Gaulton
%A J.P. Overington
%J PLoS. Comput. Biol.
%D 2014
%V 10
%O doi:10.1371/journal.pcbi.1003559
In case you haven't noticed, ChEMBL_18 has arrived. As usual, it brings new additions, improvements and enhancements both on the data/annotation, as well as on the interface. One of the new features is the target predictions for small molecule drugs. If you go to the compound report card for such a drug, say imatinib or cabozantinib, and scroll down towards the bottom of the page, you'll see two tables with predicted single-protein targets, corresponding to the two models that we used for the predictions.
- So what are these models and how were they generated?
They belong to the family of the so-called ligand-based target prediction methods. That means that the models are trained using ligand information only. Specifically, the model learns what substructural features (encoded as fingerprints) of ligands correlate with activity against a certain target and assign a score to each of these features. Given a new molecule with a new set of features, the model sums the individual feature scores for all the targets and comes up with a sorted list of likely targets with the highest scores. Ligand-based target prediction methods have been quite popular over the last years as they have been proved useful for target-deconvolution and mode-of-action prediction of phenotypic hits / orphan actives. See here for an example of such an approach and here for a comprehensive review.
- OK, and how where they generated?
As usual, it all started with a carefully selected subset of ChEMBL_18 data containing pairs of compounds and single-protein targets. We used two activity cut-offs, namely 1uM and a more relaxed 10uM, which correspond to two models trained on bioactivity data against 1028 and 1244 targets respectively. KNIME and pandas were used for the data pre-processing. Morgan fingerprints (radius=2) were calculated using RDKit and then used to train a multinomial Naive Bayesianmulti-categoryscikit-learn model. These models then were used to predict targets for the small molecule drugs as mentioned above.
- Any validation?
Besides more trivial property predictions such as logP/logD, this is the first time ChEMBL hosts non experimental/measured data - so this is a big deal and we wanted to try and do this right. First of all, we did a 5-fold stratified cross-validation. But how do you assess a model with a many-to-many relationship between items (compounds) and categories (targets)? For each compound in each of the 5 20% test sets, we got the top 10 ranked predictions. We then checked whether these predictions agree with the known targets for that compound. Ideally, the known target should be correctly predicted at the 1st position of the ranked list, otherwise at the 2nd position, the 3rd and so on. By aggregating over all compounds of all test sets, you get this pie chart:
This means that a known target is correctly predicted by the model at the first attempt (Position 1 in the list of predicted targets) in ~69% of the cases. Actually, only 9% of compounds in the test sets had completely mis-predicted known targets within the top 10 predictions list (Found above 10).
This is related to precision but what about recall of know targets? here's another chart:
This means that, onaverage, by considering the top 10 most likely target predictions (<1% of the target pool), the model can correctly predict around ~89% of a compound's known single protein targets.
Finally, we compared the new open source approach (right) to an established one generated with a commercial workflow environment software (left) using the same data and very similar descriptors:
If you manage to ignore for a moment the slightly different colour coding, you'll see that their predictive performance is pretty much equivalent.
- It all sounds good, but can I get predictions for my own compounds?
We could provide the models and examples in IPython Notebook on how to use these on another blog post that will follow soon. There are also plans for a publicly available target prediction web service, something like SMILES to predicted targets. Actually, if you would be interested in this, or if you have any feedback or suggestions for the target prediction functionality, let us know.

 Florbetaben F18 (CHEMBL1908906; Pubchem : 53257383) is a small molecule drug with a molecular weight of 359.4 Da, an AlogP of 3.75, 12 rotatable bonds, and no rule of 5 violations. Florbetaben F18is administered intravenously.Canonical SMILES: CNc1ccc(\C=C\c2ccc(OCCOCCOCCF)cc2)cc1


 As promised in the previous post, the ChEMBL target prediction models are now available to download from here. Furthermore, here is an IPython Notebook that showcases how the models can be used in Python. As usual, your feedback is very welcome.George
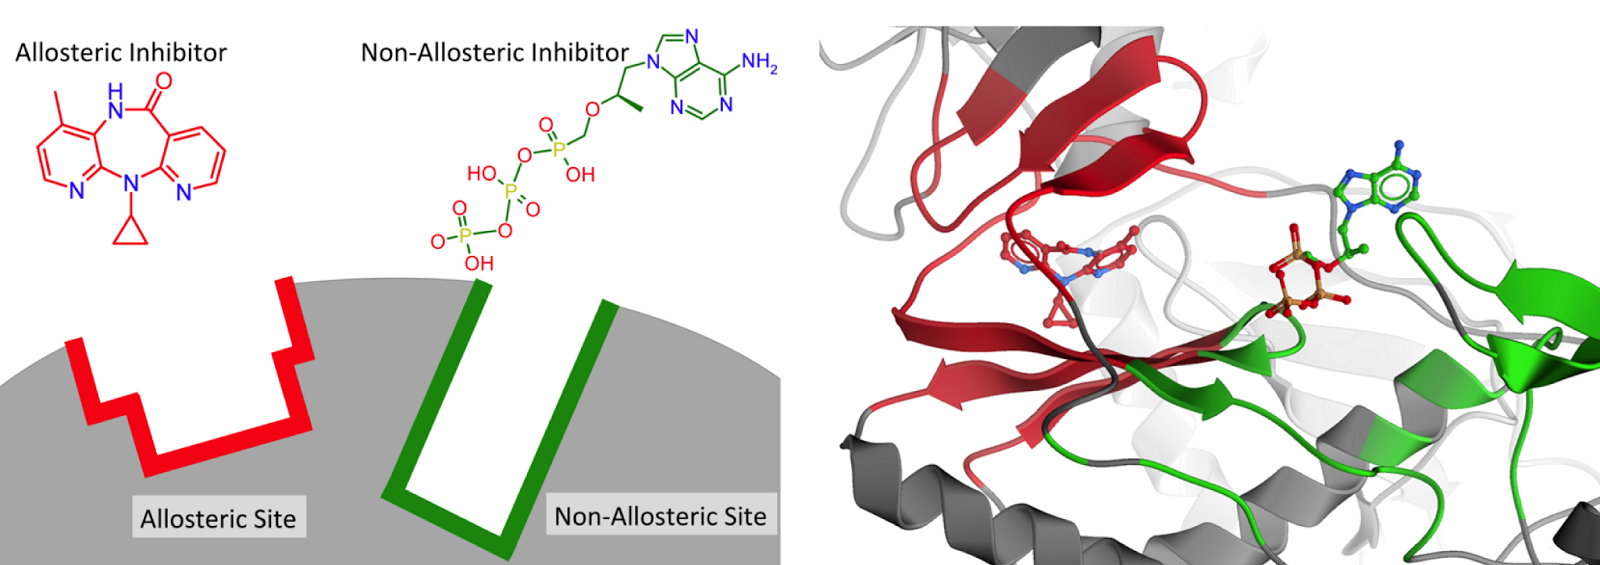 We have just had a paper accepted in PLoS Computational Biology on the work we've done on allosteric modulators (first mentioned on the blog here). The work is based on the mining of allosteric bioactivity points from ChEMBL_14. The data set of allosteric and non-allosteric interactions is available on our FTP site (here). This blogpost will just highlight some sections of the paper, but we would like to refer the interested reader to the full paper (here).DatasetThe dataset contains ChEMBL annotated and cleaned data divided in both an 'allosteric' set and a 'non-allosteric' (or background) set. Abstracts and titles mentioning allosteric keywords were pulled and from the resulting papers we extracted the primary target and all bioactivities on this primary target. From the remainder of the papers we also retrieved the primary target and all bioactivities on this primary target in a similar manner.TargetsWhen we observed the target distribution in both sets, we saw differences (see below ; also touched upon in the previous post). Targets that are known to be amenable to allosteric modulation are indeed well represented in our allosteric set (e.g. Class C GPCRs). However there are also some interesting observations that we did not expect (please see the paper for further details).
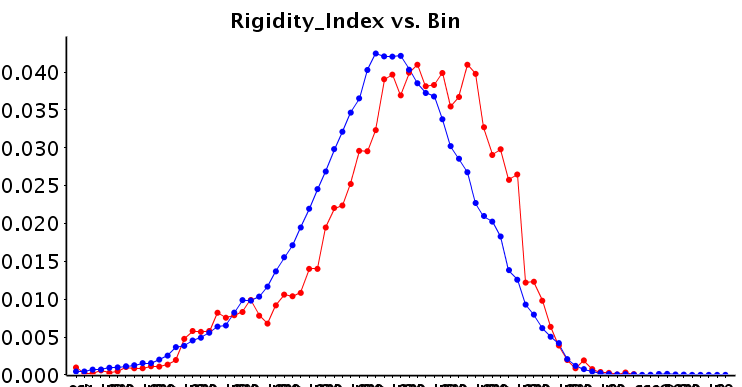
 In case you haven't noticed, ChEMBL_18 has arrived. As usual, it brings new additions, improvements and enhancements both on the data/annotation, as well as on the interface. One of the new features is the target predictions for small molecule drugs. If you go to the compound report card for such a drug, say imatinib or cabozantinib, and scroll down towards the bottom of the page, you'll see two tables with predicted single-protein targets, corresponding to the two models that we used for the predictions.- So what are these models and how were they generated?They belong to the family of the so-called ligand-based target prediction methods. That means that the models are trained using ligand information only. Specifically, the model learns what substructural features (encoded as fingerprints) of ligands correlate with activity against a certain target and assign a score to each of these features. Given a new molecule with a new set of features, the model sums the individual feature scores for all the targets and comes up with a sorted list of likely targets with the highest scores. Ligand-based target prediction methods have been quite popular over the last years as they have been proved useful for target-deconvolution and mode-of-action prediction of phenotypic hits / orphan actives. See here for an example of such an approach and here for a comprehensive review.- OK, and how where they generated?As usual, it all started with a carefully selected subset of ChEMBL_18 data containing pairs of compounds and single-protein targets. We used two activity cut-offs, namely 1uM and a more relaxed 10uM, which correspond to two models trained on bioactivity data against 1028 and 1244 targets respectively. KNIME and pandas were used for the data pre-processing. Morgan fingerprints (radius=2) were calculated using RDKit and then used to train a multinomial Naive Bayesian multi-category scikit-learn model. These models then were used to predict targets for the small molecule drugs as mentioned above.- Any validation?Besides more trivial property predictions such as logP/logD, this is the first time ChEMBL hosts non experimental/measured data - so this is a big deal and we wanted to try and do this right. First of all, we did a 5-fold stratified cross-validation. But how do you assess a model with a many-to-many relationship between items (compounds) and categories (targets)? For each compound in each of the 5 20% test sets, we got the top 10 ranked predictions. We then checked whether these predictions agree with the known targets for that compound. Ideally, the known target should be correctly predicted at the 1st position of the ranked list, otherwise at the 2nd position, the 3rd and so on. By aggregating over all compounds of all test sets, you get this pie chart:
 This means that a known target is correctly predicted by the model at the first attempt (Position 1 in the list of predicted targets) in ~69% of the cases. Actually, only 9% of compounds in the test sets had completely mis-predicted known targets within the top 10 predictions list (Found above 10).
 This means that, on average, by considering the top 10 most likely target predictions (<1% of the target pool), the model can correctly predict around ~89% of a compound's known single protein targets.Finally, we compared the new open source approach (right) to an established one generated with a commercial workflow environment software (left) using the same data and very similar descriptors:
 If you manage to ignore for a moment the slightly different colour coding, you'll see that their predictive performance is pretty much equivalent.- It all sounds good, but can I get predictions for my own compounds?We could provide the models and examples in IPython Notebook on how to use these on another blog post that will follow soon. There are also plans for a publicly available target prediction web service, something like SMILES to predicted targets. Actually, if you would be interested in this, or if you have any feedback or suggestions for the target prediction functionality, let us know.George